
The Problem
We are performing an analysis of an upcoming bid, we got our estimate done, our schedule is drafted, we even have done some simulations and risk assessments to project potential cost outcomes. Theres another aspect of the project we need to know before we commit, how much cash is the job going to take to perform.
Lets take a simple example to set the stage. We are performing a project and at the end of the first month we invoice 50k for work completed. At this point in the project we have spent 40k on labor and materials. So at the end of the first month we will be out of pocket 40k. Now the payment terms are net 30 so the first payment gets to us at the end of month two. By this time we have completed 80k more worth of work and spent 60k more. At this point we have received 50k and we have spend 100k so we are still 50k out of pocket.
Depending on the project you are bidding these numbers could be quite large and if your organization does not have the capital to float the amount of cash needed for the project you can run into a major cashflow problem. Estimating the cash in and out flows and the capital requirements for the project helps us determine wether it is fiscally responsible to take on a given project or wether we should negotiate terms that make the project more suitable for our organization’s structure or walk away from the project all together.
The Estimate/Schedule Setup
We can use any type of estimate to do this analysis but we are going to need some additional information. In this example we have cost for our labor, material, equipment, subcontractors, and other broken out (this isn’t a requirement for the analysis but if different categories have different payment terms it helps) we also are doing the analysis at the division level for the most part but you could use more or less granular data depending on your needs. We also need the start and finish dates for the line items or divisions we are working with and from those a duration (for this example we are using calendar days, you could modify the formulas and functions to use working days if you wanted). There is a column that adds up all our cost categories and gives us the total cost and there is a column for our revenue. From there we need columns that take our costs and revenue in their respective categories and divide by the duration to give us the cost or revenue per day.
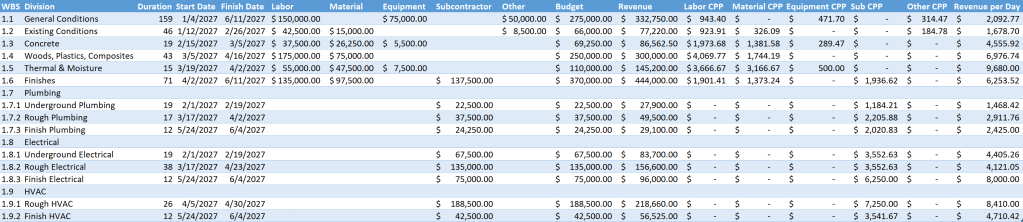
Note: It will be helpful to add all your data to a table as it is far easier to write formulas in a table and far easier to reference data in a table.
The Cashflow Table Setup
We now need a table that can take our estimate data and place that data throughout the time frame of the project. The date column should span from the start of the project (I typically go a bit before) till the end of the project (the end is the end of the payment cycle not the end of work in place, I typically go a month beyond that point and adjust the table from there). Youll then need a column for each of you cost types and one for the revenue and also a column for the cumulative of each cost type and the revenue.
Notice above the table we made a row for payment terms. We will reference this in our formula to shift our cost and revenue forward in time based on our payment terms. If we hire a equipment vendor and we pay them monthly but the first payment doesn’t go out till the end of the first month then there payments need to be shifted forward by 30 days as that is when the cost will be incurred. Same goes for all the other cost types and our revenue. Labor is typically incurred in the period we are working so it has no payment terms but if you want to get more granular you could adjust this to fit your organization.
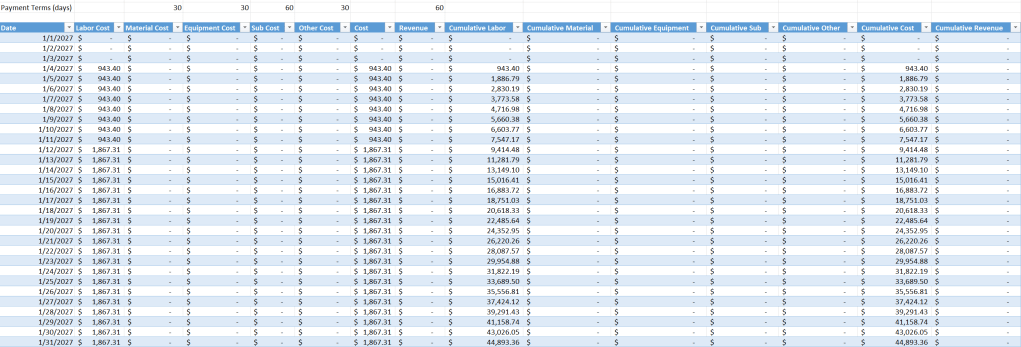
For the cost over time columns (not the cumulative) we will use a formula like the one below.
=SUMIFS(schedule[Material CPP], schedule[Start Date],"<="&[@Date]-$D$2, schedule[Finish Date],">="&[@Date]-$D$2)
Because we are using a table for both this data and our source data our formula will reference tables not cells. In this formula we are performing a SUMIF() function which is looking for a specific criteria. It is checking our estimate and seeing if any of the cost within the start and end date range falls on the current rows date. It then is referencing our payment terms to shift that data forward in time.
For the cumulative costs we would use a formula like the one below.
=SUM(day_cash_behind[[#Headers],[Material Cost]]:[@[Material Cost]])
There are multple ways to get cumulative costs and I have used some of them in past articles, for this one we are going to use a header reference. Using a simple SUM() function placed in the first row of data we sum from the header day_cash_behind[[#Headers],[Material Cost]] through the row we are on [@[Material Cost]] this means that each row includes the sum of all the rows above it.
The Second Scenario
Now that you have the data in place for the current scenario, make a copy of the table (you can always just make a copy of the worksheet) and lets change some parameters. Assume that there is a snag in payment from the client and our payments are delayed by 30 days making the payment cycle 60 days. With this change we have a new scenario that will show the impact of an issues like this happening.
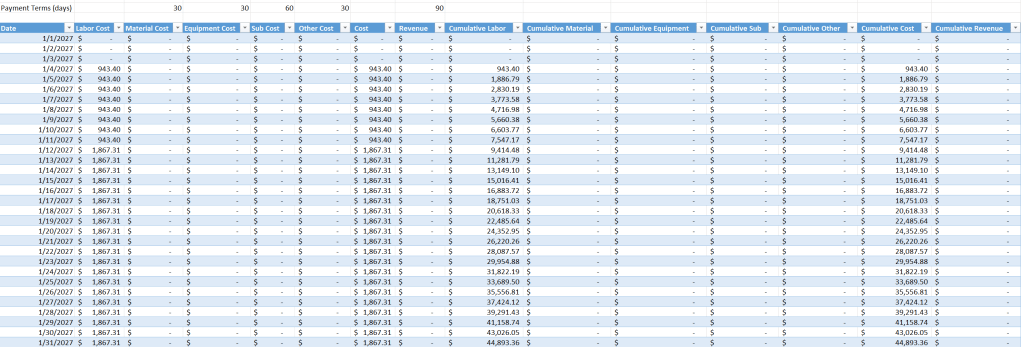
You now should have three tables of data, the estimate and the two cash flow tables.
Visualizing the Data
Now to visualize this data so we can really explore the impact. I am not going to walk through all the steps on how to get this data into PowerBI, if you need to learn how to import data into PowerBI and get a basic visual done please refer to Getting Started (Part VI).
Once your data is in PowerBI create a combo chat with a stacked column and line. For this chart you will add the different cost types to the y column axis, the cumulative cost to the y line axis, and the date to the x axis.
Note: When importing the data make sure the date column is a date data type, change if needed. When you add the date to the x axis it should show a hierarchy of year, quarter, month, day. Feel free to delete the days and quarters out of the field for the visual and it will collapse the data down to months.
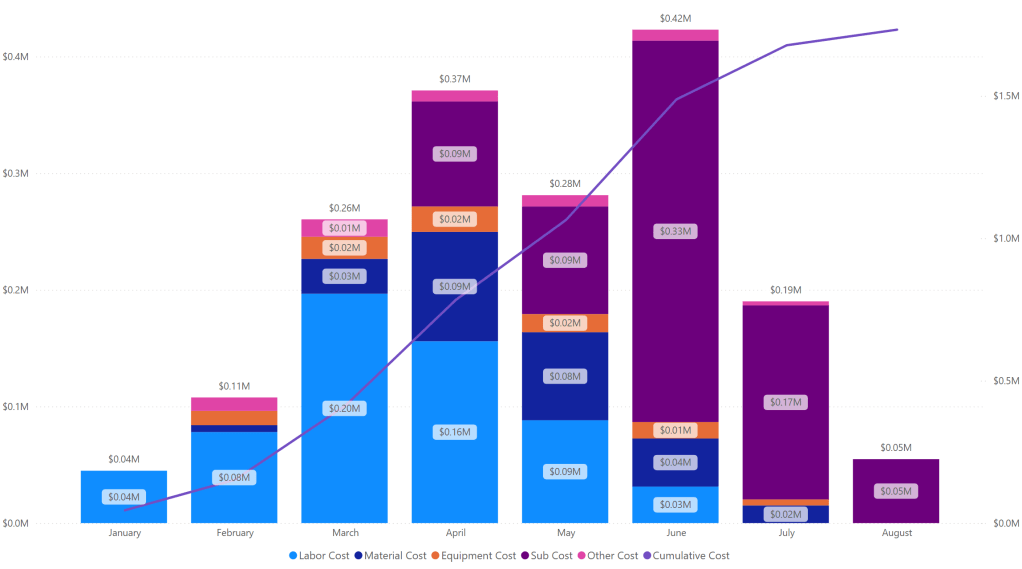
Now we have a good picture of our costs over time for the project. The stacked columns will show us the make up of the total cost per period and the cumulative shows us the progress of cost over the project.
Now make a second page and add a clustered column and line combo chart and here we will add the cost and revenue data to the y axis column field and the cumulative cost and revenue to our y axis line fields. This gives us a chart that shows cost and revenue over time. The gap between the two cumulative lines shows you the amount of cash you need throughout the project.
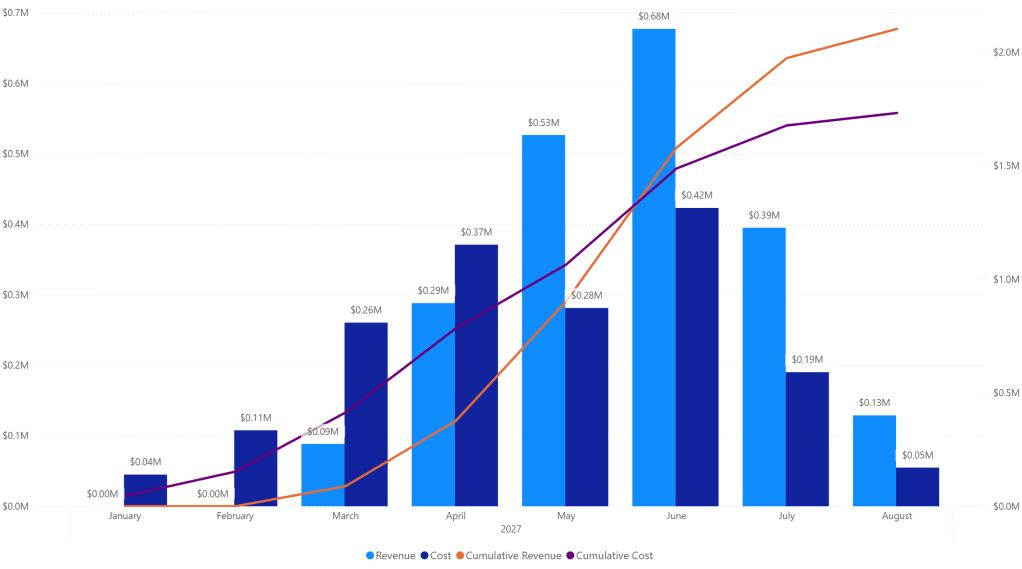
For our final visual we will need to add a few columns to our data in PowerBI and perform some calculations so that we are able to show the capital requirements for each month or period.
In the table view in PowerBI and in the table tools tab in the ribbon click add column, you will add three columns one for the delta between budget and revenue, one for the cumulative delta between budget and revenue, and one for the month end cumulative to use on the chart.
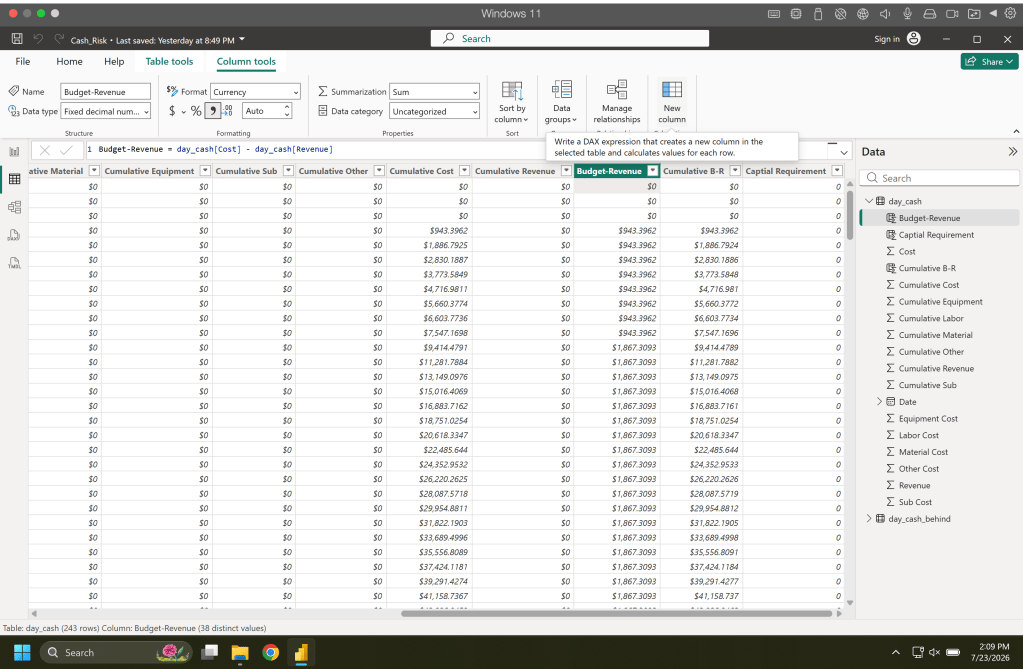
The first column is a simple cost minus revenue formula as seen below.
Budget-Revenue = day_cash[Cost] - day_cash[Revenue]
The second formula we are getting the cumulative of the last column we made. We start the formula with the CALCULATE() function which takes an expression and them filters to modify the data. Inside this we use a SUM() function where we sum up the column we made in the last step. For our filters to the CALCULATE() function we first use ALL() and pass this our table, this returns all the rows. Next we use the filter day_cash[Date] <= EARLIER(day_cash[Date]) which filters all the dates that are earlier than the current rows date and since we are summing the budget-revenue column it will return the cumulative value for each row.
Cumulative B-R = CALCULATE(SUM(day_cash[Budget-Revenue]), ALL(day_cash), day_cash[Date] <= EARLIER(day_cash[Date]))
Note: While some of these formulas look similar to those you may be used to in excel we are actually using DAX which is a different language and has its own formula structure (syntax).
Now lastly we need to only show the end of month data as thats the number we are after. In our next column we would write the following formula. This formula uses the EOMONTH() function to find the end of month and then uses an if statement to only bring in data on that date.
Captial Requirement = if(day_cash[Date] = EOMONTH(day_cash[Date], 0), if(day_cash[Cumulative B-R]>0, day_cash[Cumulative B-R], 0), 0)
Once we got that done we can now, back on our visual view, make a new page and add a clustered column chart. We add the revenue, cost, and capital requirements data to our y axis and the date to our x axis and we have a chart showing the amount of capital we need in a given period.
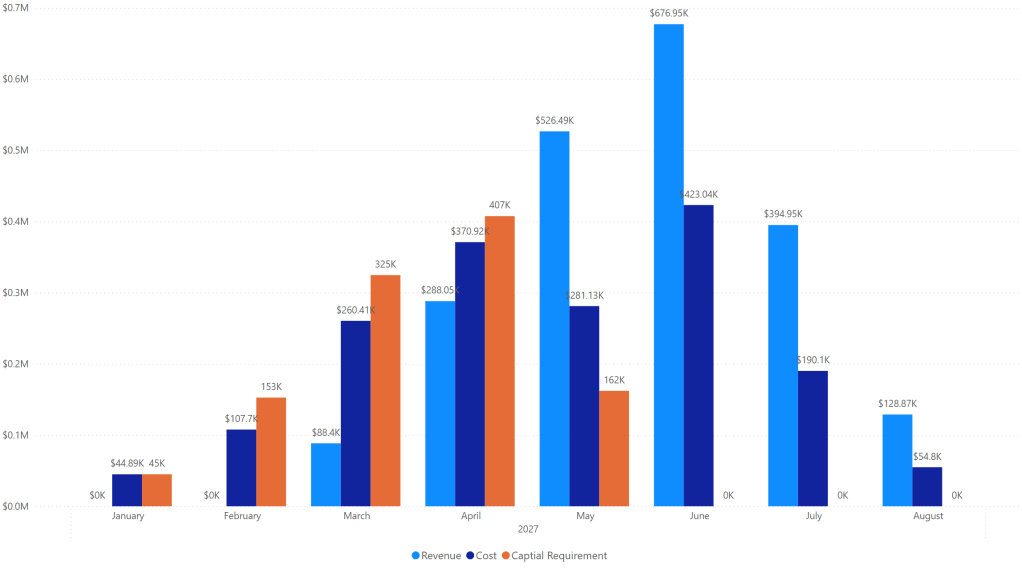
From this visual we can see that the max we will need to come out of pocket is around 407k and that we will be cash out until the sixth month of the project when we become cash positive for the project.
Now make this same chart for the other scenario we created in our data and look at the difference.
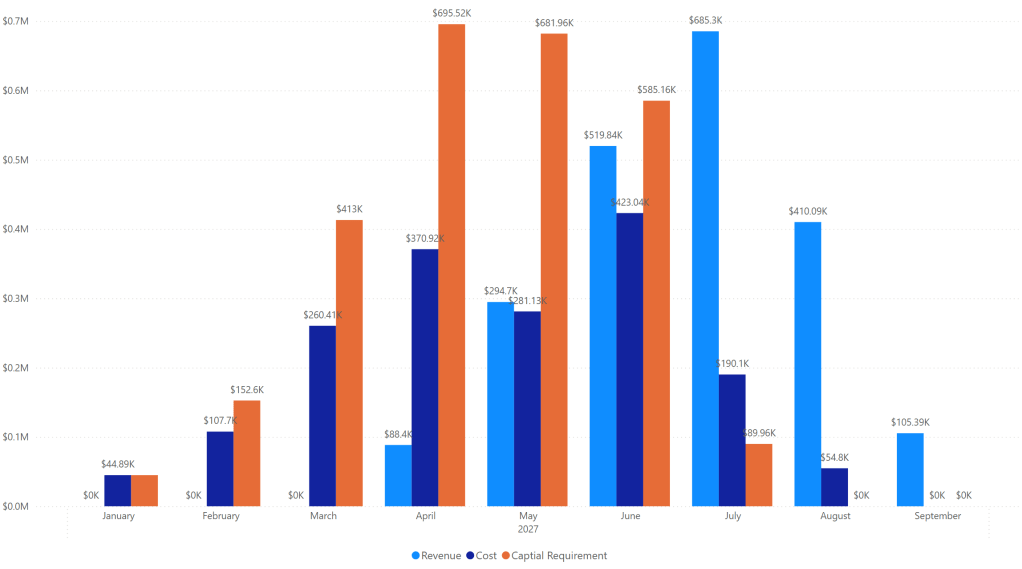
Here a one month delay in payment on the job that pushes all future payments out would require us to have a max of almost 700k out and we would need to have cash out till the 8th month of the project.
Based on this analysis we can determine how much we need to take on this project and what the risks of the different cashflow scenarios are. We could model all kinds of scenarios just by updating our data. The example here is a fairly small and straight forward example, try this with something more complex, try and run different simulations using these numbers, play around with the process.
Lastly model some past jobs and then check the actuals from the jobs and see how accurate your model is. Use the historical data to inform your model and adjust the parameters to make these types of estimations as close to reality as possible.
Resources
The code, notebooks, and files used in this articles can be found in the companion github repository by clicking the button below.

